The world economy powers our daily lives. It connects factories in China to stores in New York and farms in Brazil to kitchens in Europe. In 2025, this massive system produces about $117 trillion in goods and services each year. That’s the total world economy in trillion dollars, measured by nominal GDP. This pillar guide breaks it all down. We cover world economy ranking, growth drivers, big risks like tariffs and AI, and smart paths forward. Whether you make policy, run a business, or just follow global news, you’ll find clear facts, stats, and tips here.
Think of the world economy as a giant engine. Countries trade parts to keep it running. When one part slows—like during COVID—it affects everyone. Today, it bounced back strongly. Growth hits 3.2% this year, per IMF data. But threats loom: US and China economic rivalry, climate shocks, and debt piles. We dive deep into each. Plus, we rank the top 10 world economy nations and spotlight stars like India in world economy (fifth by nominal GDP).
This article draws from top sources like the World Economy journal1, IMF reports, and recent news from The Economist2. Ready? Let’s start with the basics.
What Is the World Economy? A Simple Breakdown
The world economy means all buying, selling, making, and saving across the planet. It started small with ancient silk roads. By 1800, global trade was tiny. Fast-forward to now: Planes, internet, and ships link us tight.
Key parts:
- Production: Factories make phones, cars, food.
- Trade: Ships carry $28 trillion in goods yearly.
- Finance: Banks lend $100 trillion+ in total global debt crisis levels.
- Services: Apps, banking, tourism add 65% of rich-country GDP.
Economic indicators tell its health:
- GDP Growth: How fast it expands (3.2% in 2025).
- Inflation: Price rises (down to 3.4% globally).
- Unemployment: Jobs available (5.2% average).
- Trade Balance: Exports minus imports.
Purchasing Power Parity (PPP) fixes unfair comparisons. It says what $1 buys in each place. By PPP, the world economy GDP hits $143 trillion—bigger than nominal because life costs less in India or Indonesia.
Fun fact: The world economy equals 1,500 times one rich country’s output. It grew 3x since 2000, thanks to China and India joining the party.
For business owners eyeing global moves, check how to start a small business to tap this flow.
World Economy Ranking 2025: Who Leads and Why
World economy3 ranking changes yearly. In 2025, nominal GDP crowns the largest economy in the world as the United States at $30.6 trillion. China follows at $19.4 trillion. Here’s the full world economy ranking 2025 table:
| Rank | Country | Nominal GDP ($ Trillion) | PPP GDP ($ Trillion) | Growth Rate (%) | Key Strength |
| 1 | United States | 30.6 | 30.6 | 2.8 | Tech, services, innovation |
| 2 | China | 19.4 | 41.0 | 4.0 | Manufacturing, exports |
| 3 | Germany | 5.0 | 6.0 | 1.3 | Exports, engineering |
| 4 | Japan | 4.3 | 6.9 | 1.0 | Autos, electronics |
| 5 | India | 4.1 | 17.7 | 6.8 | IT, consumer market |
| 6 | United Kingdom | 4.0 | 4.5 | 1.5 | Finance, services |
| 7 | France | 3.4 | 4.6 | 1.4 | Tourism, luxury goods |
| 8 | Italy | 2.5 | 3.7 | 0.8 | Fashion, machinery |
| 9 | Canada | 2.3 | 2.7 | 1.7 | Resources, energy |
| 10 | Brazil | 2.3 | 5.1 | 2.2 | Agriculture, commodities |
Source: IMF World Economic Outlook, October 2025.
World top 10 economy shifts: India jumps from 10th in 2015. World’s third largest economy? Germany nominally, but India by PPP. The world’s largest economy in 2025 stays in the U.S., but China closes the gap.
Now, states count too. California economy ranking in the world 2025? Fourth globally at $4.2 trillion—bigger than Japan! Is California the fourth largest economy in the world? Yes, thanks to Silicon Valley tech. Texas economy ranking in the world? Eighth at $2.7 trillion, fueled by oil and trade.
Top 5 world economy basics:
- U.S.: Who has the biggest economy in the world? This one. Apple, Google drive it.
- China: World largest economy by PPP. Factories make half global goods.
- Germany: Export king—cars to everywhere.
- Japan: Stable, but aging population slows it.
- India: World’s fastest growing economy among big ones at 6.8%.
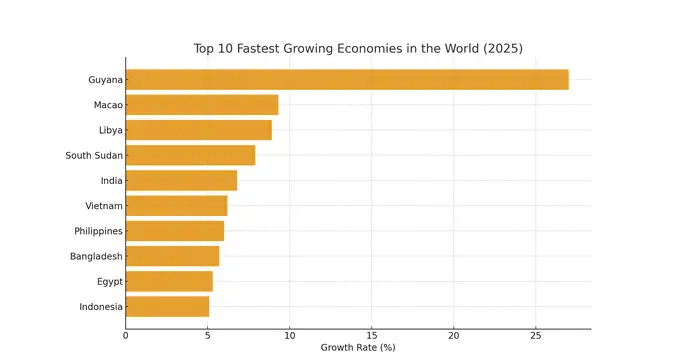
The top 10 fastest growing economies in the world include tiny nations: Guyana (27% from oil), Macao (9%). But for scale, India leads majors.
These ranks matter. Leaders get more IMF votes, attract investors. Investors see startup funding options for first-time entrepreneurs to ride winners.
Fastest Growing Economies: Engines of the World Economy 2025
Growth = future power. Fastest growing economy in the world 2025? South Sudan at 7.9%, but volatile. Stable picks:
- India: 6.8%. Why? Young workers, digital push. World 4th largest economy now, third by 2030.
- Indonesia: 5.1%. Nickel, palm oil boom.
- Vietnam: 6.2%. Factories flee China.
- Philippines: 6.0%. Remittances, services.
World’s fastest growing economy list (top 10):
- Guyana: 27.0% (oil discovery)
- Macao: 9.3% (tourism rebound)
- Libya: 8.9% (energy)
- South Sudan: 7.9%
- India: 6.8%
- Vietnam: 6.2%
- Philippines: 6.0%
- Bangladesh: 5.7%
- Egypt: 5.3%
- Indonesia: 5.1%
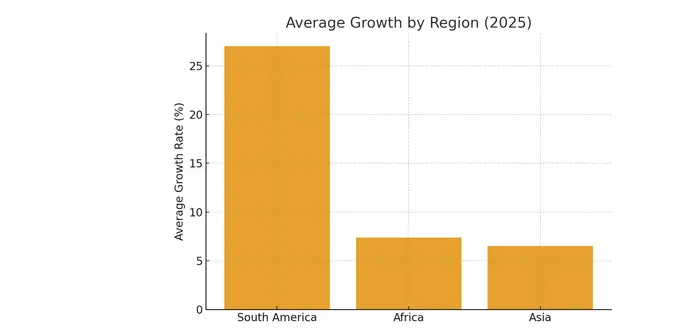
Emerging Asia drives 70% of global growth. Africa lags but rises with reforms.
Global GDP Deep Dive: How the World Economy in Trillion Dollars Works
World economy in dollars? $117.2 trillion nominal in 2025. World economy GDP splits:
- Advanced economies: 58% ($68 trillion), slow growth (1.7%).
- Emerging/developing: 42% ($49 trillion), fast (4.2%).
Sectors:
| Sector | Share of Global GDP | Examples | Growth Driver |
| Services | 65% | Banking, IT, retail | Digital tools |
| Industry | 25% | Manufacturing, construction | AI automation |
| Agriculture | 4% | Farming, fishing | Climate tech |
| Other | 6% | Mining, utilities | Green energy |
Consumption rules: 55% global. Investment: 25%. Governments spend 18%. Net trade: 2%.
World economy list by region:
- Asia: 50%+ GDP.
- Europe: 22%.
- North America: 26%.
- Rest: 2%.
Economic Globalization: Boom, Bust, and Backlash
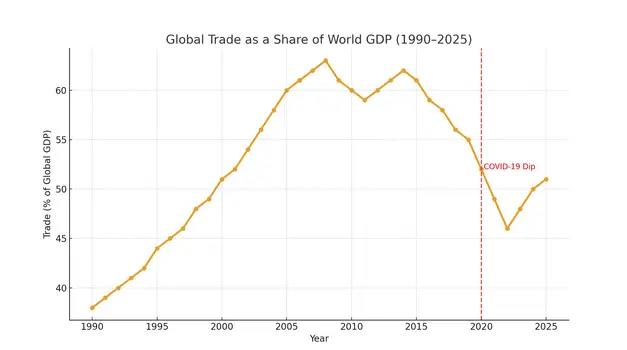
Economic globalization has linked us since the 1990s. Trade tripled to $32 trillion. Wins: Cheaper phones, more jobs in poor places.
But geopolitical tensions in trade reverse it. Trade and investment fragmentation rises, per CEPR Geneva Report4. Flows drop 10% between U.S.-China blocs.
Pros:
- Efficiency: Best makers win.
- Poverty cut: 1 billion lifted since 1990.
- Innovation spread.
Cons:
- Job loss in old factories.
- Inequality up.
- Supply shocks (COVID).
Role of trade agreements: WTO, CPTPP keep doors open. International trade and tariffs? Tariffs add 1-2% to prices.
Impact of AI on the Global Economy: Game-Changer or Job Killer?
Impact of AI on the global economy? Huge. AI adds $15.7 trillion to GDP by 2030—16% boost. AI-driven productivity growth hits 1.5% yearly.
Sectors:
- Healthcare: AI diagnoses faster, saves $150B/year.
- Finance: Fraud detection, robo-advisors.
- Manufacturing: Robots cut costs 20-30%.
Jobs: 97 million new by 2025, but 85 million lost. Retrain workers! In the best AI tools for small business productivity, learn easy starts.
Fears? The world economy shrugs off AI fears, per The Economist5. Growth stays solid.
Digital transformation in the economy: Cloud, 5G speed it. E-Commerce and Global Connectivity: $6.5 trillion sales in 2025.
Global Inflation Trends: Cooling but Sticky
Global inflation trends: Peaked 8.7% in 2022, now 3.4%. U.S.: 2.4%. Turkey: 40%+.
Causes:
- Supply shocks (wars, pandemics).
- Demand boom post-COVID.
- Energy prices.
Inflation and economic inequality: Hits poor hardest—food up 20%. Central banks hike rates to tame it.
Tips for businesses: Lock prices, hedge costs. See how to manage cash flow in a small business.
Economic Impact of Climate Change: The Trillion-Dollar Threat
Economic impact of climate change: $2.8 trillion lost yearly by 2030. 1°C warming cuts GDP 12% long-term.
Hot spots:
- Africa: 15% GDP hit.
- India: Crop failures cost $50B/year.
Green wins: Renewables create 12 million jobs. Technological innovation in economics like solar drops costs 89% since 2010.
Policy: Carbon taxes, subsidies. Sustainable packaging ideas for small businesses help adapt.
International Trade and Tariffs: Fragmentation Ahead?
International trade and tariffs: Goods trade up 3.3% in 2025. But Trump’s 60% China tariffs loom, per Politico6.
Effects:
- Higher prices: +$1,200/year per U.S. family.
- Supply shifts: Mexico, Vietnam gain.
- Global supply chain challenges: Nearshoring rises 20%.
Global financial markets trends: Stocks volatile but up 10% YTD.
US and China Economic Rivalry: The New Cold War?
The rivalry between the United States and China has reshaped global dynamics, turning economic interdependence into a battleground of tariffs, technology bans, and strategic posturing. As of October 2025, with escalating trade tensions under President Trump’s second term, many analysts ask: Is this the dawn of a new Cold War? Unlike the ideological U.S.-Soviet standoff of the 20th century, today’s conflict blends economic warfare with technological supremacy and supply chain control. Yet, the stakes feel eerily similar—mutual economic disruption as a deterrent, proxy battles in third countries, and a web of alliances pulling the world into opposing blocs. This article unpacks the roots, recent escalations, impacts, and whether “Cold War 2.0” is inevitable. Drawing from fresh reports and data, it offers a clear-eyed view for policymakers, business leaders, and global watchers.
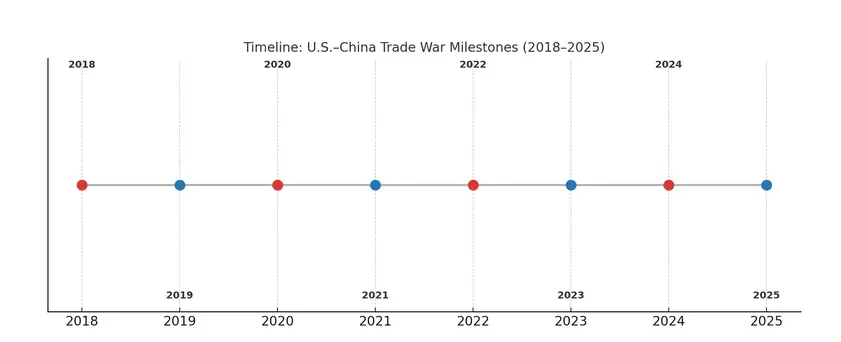
Historical Roots: From Engagement to Escalation
The U.S.-China economic tie-up began in earnest with Richard Nixon’s 1972 visit to Beijing, aiming to counter the Soviet Union. By the 1990s, China’s “Reform and Opening” under Deng Xiaoping flooded U.S. markets with cheap goods, lifting a billion from poverty while fueling American consumer booms. China joined the WTO in 2001, locking in low tariffs that supercharged its export machine—U.S. trade deficits ballooned to $419 billion by 2018.
Fast-forward to the 2010s: Alarm bells rang in Washington. Initiatives like “Made in China 2025″—a blueprint for tech self-reliance in semiconductors, AI, and EVs—signaled Beijing’s bid to leapfrog from factory floor to innovation hub. U.S. policymakers saw this as a threat to American dominance, not just in trade but in defining the global order. Enter Donald Trump: His 2016 campaign decried China as a “currency manipulator” and job thief. By 2018, the first salvos fired—25% tariffs on steel and aluminum, sparking tit-for-tat retaliation.
The Biden interlude (2021-2025) paused the frenzy but hardened restrictions on tech exports, like chips to Huawei. Trump’s return in January 2025 reignited the fire: Executive orders under the International Emergency Economic Powers Act (IEEPA) slapped 10% tariffs on all Chinese imports by February 4, doubling to 20% on “fentanyl-related” goods by March. China hit back with 15% on U.S. coal and LNG, plus export curbs on rare earths—vital for EVs and defense.
Key milestones in 2025:
- February 1: Trump declares a “national emergency” on fentanyl, justifying broad tariffs.
- April 9: Tariffs spike to 145% on Chinese goods; China retaliates at 125%.
- October 10: Trump threatens 100% tariffs and software bans after China’s rare earth clampdown, erasing $1.5 trillion in market value overnight.
This isn’t mere haggling—it’s a strategic pivot. As one former Trump official noted, the focus has fused economics with national security, risking a “balance of economic terror.”
Core Battlegrounds: Trade, Tech, and Resources
Trade Tariffs: The Blunt Weapon
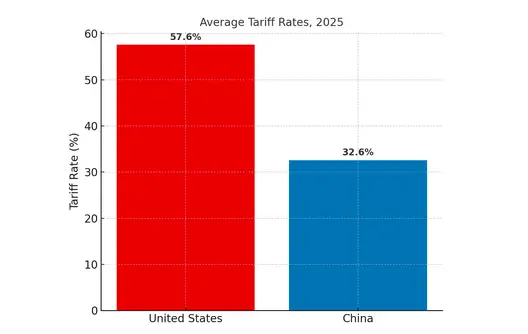
Tariffs are the rivalry’s flashpoint. By October 2025, U.S. duties on Chinese imports averaged 57.6%, covering 100% of goods—up 36.8 points since Trump’s inauguration. China’s retaliation clocks in at 32.6% on U.S. exports. These aren’t surgical; they’re sledgehammers.
- Direct Hits: U.S. consumers face $1,200 extra annually per household. Chinese exports to the U.S. plunged 33% in August.
- Ripple Effects: Soybeans, once a U.S. staple to China, cratered post-2018; 2025 sees oil imports from America slashed 90%.
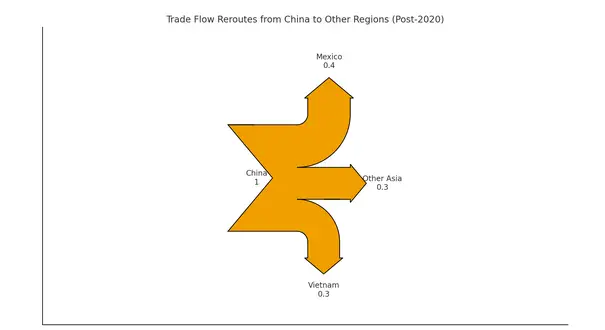
- Global Fallout: Mexico overtook China as top U.S. trading partner in 2024 ($142B imports via Vietnam rerouting). Europe feels the pinch—Chinese rare earth curbs hike costs for German automakers.
Shipping’s next: China hiked port fees on U.S. vessels October 15, straining the industry that hauls 80% of world trade. IMF forecasts? China’s 2025 growth at 4.8%, resilient via stimulus, but U.S. risks 0.5% GDP shave.
Technology: The High-Stakes Frontier
Tech is where rivalry turns existential. U.S. export controls block advanced chips to China, stunting Huawei’s AI ambitions. China’s response? Billions into “Made in China 2025” redux, targeting semiconductors via firms like SMIC.
- AI and Semiconductors: U.S. warnings on Huawei’s Ascend chips cite export violations. China eyes renminbi internationalization to dodge SWIFT sanctions.
- 5G and Beyond: Bans on ZTE echo Cold War tech races, but with cyber edges—think state-sponsored hacks.
- Student Flows: Rubio’s visa revocations for Chinese STEM scholars signal “brain drain” fears.
This arms race could add $15T to global GDP by 2030 via innovation—or trigger a “splinternet” of divided digital worlds.
U.S. vs China: 2025 Snapshot
| Metric | United States | China |
|---|---|---|
| Nominal GDP (USD Trillions) | 28.8 | 18.5 |
| PPP GDP (USD Trillions) | 28.8 | 33.5 |
| Tariff Rate (%) | 57.6 | 32.6 |
| Share of Global Exports (%) | 8.2 | 14.1 |
| Top Export Partners | Canada, Mexico, EU | ASEAN, EU, U.S. |
| Key Strategic Strengths | Technology, Finance, Innovation | Manufacturing, Infrastructure, Scale |
Resources and Supply Chains: Chokepoints
China controls 80% of rare earths; its October 2025 curbs on magnets and devices threaten U.S. defense and EVs. Trump’s 100% tariff retort risks derailing the APEC summit.
Supply chains reroute: Vietnam’s U.S. imports hit $142B in 2024. But “friendshoring” to Mexico or India can’t fully replace China’s scale—yet.
| Battleground | U.S. Leverage | China Leverage | 2025 Impact |
| Trade | Market access, dollar dominance | Manufacturing scale, export surplus | U.S. deficit narrows 10%, but consumer prices +5% |
| Tech | Chip design, alliances (e.g., TSMC) | Assembly, domestic R&D | Global AI growth slows 2% |
| Resources | Diversification pacts (e.g., Australia) | Rare earth monopoly | EV costs up 15-20% worldwide |
Global Repercussions: A World in the Crossfire
This duo’s spat ensnares everyone. IMF’s October 2025 outlook: Global growth dips to 3.1% from tariff drag. Europe: Auto tariffs add €50B in costs. India: Modi courts China amid U.S. threats.
- Emerging Markets: Vietnam wins factories; Africa sees Chinese BRI cash amid U.S. pullback.
- Alliances: NATO hikes spending; China-Russia-Iran pacts solidify.
- Climate: Geneva summit flops—U.S. carbon taxes vs. China’s coal subsidies stall Paris goals.
Businesses scramble: Retailers pass fees to shoppers; shippers face chaos. X chatter echoes frustration—one user laments, “Trade war drags on with no end,” highlighting canceled Trump-Xi talks.
Is It a New Cold War? Parallels and Perils
Echoes abound: Bipolar blocs, proxy fights (e.g., South China Sea), ideological clashes—democracy vs. authoritarianism. Trump’s “strategic competition” mirrors containment; Xi’s “multipolar world” evokes Soviet spheres.
But differences loom:
- Interdependence: U.S.-Soviet trade was negligible; today, it’s $700B+ annually. Decoupling hurts both—China’s growth slowed to 4.8%, U.S. inflation ticks up.
- No Iron Curtain: Tech and finance entwine; a “splinternet” risks cyber mutual assured destruction.
- Multipolarity: India, EU play both sides—no clear camps.
Analysts warn: The “Cold War” label breeds fatalism, inviting missteps like overconfidence in escalation control. As Brookings notes, “Cooperative rivalry” on climate or pandemics is essential—no solo wins.
X sentiments vary: Some decry tariffs as “hidden taxes” sparking retaliation, others see China’s resilience as trade war “victory.”
Paths Forward: De-Escalation or Deepening Divide?
A May 2025 truce slashed tariffs temporarily, but October’s rare earth spat revived brinkmanship. Upcoming APEC summit (October 31) could broker a deal—or blow it up.
Options:
- Negotiate Smart: Phase 1 redux—China buys U.S. ag, opens markets; U.S. eases tech curbs.
- Diversify: U.S. inks Australia rare earth pacts; China boosts African BRI.
- Multilateral Fix: WTO reforms, IMF-led talks to curb weaponized trade.
For businesses: Hedge with nearshoring; policymakers: Restore military hotlines to avoid flashpoints.
Global Supply Chain Challenges and Fixes
Global supply chain challenges:
- Geopolitics: Red Sea attacks add 10% costs.
- Labor shortages.
- Climate events.
Fixes:
- Diversify suppliers.
- Use AI for forecasts.
- Stock buffers.
For e-com, how to scale an online store with low budget.
Global Debt Crisis: A Ticking Bomb?
The global debt crisis in 2025 looms large, with total global debt hitting $318 trillion—328% of GDP—up $7 trillion from 2024. Public debt alone surged past $102 trillion, driven by crises and uneven recoveries. Emerging economies face the brunt, rolling over $8.2 trillion amid high interest rates and trade shocks. Is it a bomb? Projections warn: Public debt could reach 100% of global GDP by 2030, or 117% in adverse scenarios by 2027.
Key drivers:
- Post-Pandemic Surge: COVID stimulus added trillions; debt service costs hit 3.3% of GDP ($2T+).
- Rising Rates: From near-zero to 5%+ hikes, doubling burdens in developing nations.
- Geopolitical Pressures: Tariffs, wars boost defense spending; U.S.-China tensions fragment flows.
- Inequality: Developing countries’ debt grew twice as fast since 2010, at $31T (30% global).
| Metric | 2024 Value | 2025 Projection | Risk Factor |
| Global Public Debt | $102T (97% GDP) | $107T+ (100% GDP) | Defaults in EMs |
| Developing Economies | $31T (2x growth) | $35T+ | $25B net outflow |
| Debt Service Costs | 3.3% GDP ($2T) | 4%+ GDP | Cuts to aid/investment |
Risks: Crises in 80% of global GDP economies; unidentified debt (40% from SOEs) hides bombs. Solutions? Reforms: Inclusive finance, fiscal anchors, transparency.
| Country | GDP 24 | Growth 24 | Population – 24 | Per Capita 24 | % of World GDP 24 | Imports 24 | Exports 24 | Debt 24 | Gold Reserves 24 |
|---|---|---|---|---|---|---|---|---|---|
| 🇺🇸 United States | $29.18 T | 2.80% | 347 M | $85,810 | 26.20% | $4.14 T | $3.23 T | $36.2 T | 8,133.46 Tons |
| 🇨🇳 China | $18.42 T | 5.00% | 1.425 B | $13,200 | 16.70% | $2.56 T | $3.58 T | $16.65 T | 2304 Tons |
| 🇩🇪 Germany | $4.66 T | −0.2 % | 83.6 M | $55,800 | 4.20% | $1.425 T | $1.682 T | $2.90 T | 3,352 Tons |
| 🇯🇵 Japan | $4.03 T | 0.10% | 123.8 M | $33,960 | 3.70% | $0.75 T | $0.71 T | $8.67 T | 846.0 Tons |
| 🇮🇳 India | $3.91 T | 6.70% | 1.467 B | $2,697 | 3.70% | $0.68 T | $0.44 T | $3.16 T | 876 Tons |
| 🇬🇧 United Kingdom | $3.50 T | 1.3 % | 68.3 M | $47,265 | 3.20% | $1.14 T | $1.10 T | $3.73 T | 310 Tons |
| 🇫🇷 France | $3.16 T | 1.10% | 68.4 M | $46,240 | 3.00% | $0.86 T | $0.76 T | $3.30 T | 2,437 Tons |
| 🇮🇹 Italy | $2.3 T | 0.7 % | 58.93 M | $40,224 | 2.00% | $0.62 T | $0.64 T | $3.19 T | 2,452 Tons |
| 🇧🇷 Brazil | $2.18 T | 3.40% | 212.6 M | $10,600 | 2.05% | $0.263 T | $0.337 T | $1.90 T | 129.65 Tons |
| 🇨🇦 Canada | $2.24 T | 1.60% | 41.1 M | $54,900 | 2.10% | $765.7 B | $721.1 B | $0.90 T | 0 |
| 🇷🇺 Russia | $2.17 T | 4.10% | 146 M | $15,100 | 2.00% | $285.3 B | $425.3 B | $439 B | 2,330 Tons |
| 🇲🇽 Mexico | $1.85 T | 1.50% | 129.4 M | $14,310 | 1.75% | $625.3 B | $617.1 B | $1.082 T | 120 Tons |
| 🇦🇺 Australia | $1.75 T | 1.30% | 26.7 M | $64,821 | 1.65% | $614.1 B | $644.4 B | $598 B | 80 Tons |
| 🇰🇷 South Korea | $1.87 T | 2.20% | 51.7 M | $36,132 | 1.70% | $632 B | $684 B | $934 B | 104.4 Tons |
| 🇪🇸 Spain | $1.72 T | 3.20% | 48.4 M | $35,610 | 1.57% | $469 B | $424 B | $1.17 T | 282 Tons |
| 🇮🇩 Indonesia | $1.40 T | 5.03% | 281.6 M | $4,981 | 1.27% | $235.2 B | $259.9 B | $539.4 B | 78.57 Tons |
| 🇳🇱 Netherlands | $1.162 T | 1.1 % | 18.0 M | $68,500 | 1.16 % | $637 B | 726 B | $4.4 T | 612.5 Tons |
| 🇹🇷 Turkey | $1.32 T | 3.2 % | 85.66 M | $15,461 | 1.25 % | $344.1 B | 261.9 B | $343.66 B | 635 Tons |
| 🇸🇦 Saudi Arabia | $1.24 T | 1.30% | 35.3 M | $35,057 | 1.17 % | $215 B | 305 B | $319.7 B | 323.1 Tons |
| 🇨🇭 Switzerland | $905 B | 1.3 % | 9.05 M | $103,670 | 1.1 % | $371.4 B | 446.8 B | $2.32 T | 1,040 Tons |
| 🇵🇱 Poland | $927.3 B | 2.90% | 37.5 M | $25,023 | 0.82% | $379.5 B | $380.3 B | $459.375 B | 515 Tons |
| 🇦🇷 Argentina | $633.3 B | 1.70% | 45.70 M | $13,858 | 0.60% | 61 B | 80 B | $282.8 B | 61.7 Tons |
| 🇧🇪 Belgium | $664.6 B | 1.20% | 11.7 M | $56,500 | 0.63 % | $525 B | 575 B | $688.5 B | 227.4 Tons |
| 🇸🇪 Sweden | $610.1 B | 0.60% | 10.57 M | $57,723 | 0.55% | $189 B | $195.8 B | $980.4 B | 125.7 Tons |
| 🇮🇪 Ireland | $577.4 B | 1.20% | 5.38 M | $107,316 | 0.54% | $145 B | $242 B | $3,177 B | 12.04 Tons |
| 🇹🇭 Thailand | $526.4 B | 2.50% | 71.67 M | $7,345 | 0.50% | $276.4 B | $287.0 B | 11.85 T | 234.52 Tons |
| 🇦🇪 United Arab Emirates | $507 B | 3.90% | 11.08 M | $51,350 | 0.45%. | $75.2 B | $51.8 B | $8.3 B | 24.2 Tons |
| 🇮🇱 Israel | $513.6 B | 2.42% | 9.2 M | $45,169 | 0.51% | $89.5 B | $61.7 B | $1.33 T | 0 |
| 🇦🇹 Austria | $535.8 B | -0.60% | 9.13 M | $58,669 | 0.48% | $204.40 B | $206.42 B | $444.0 B | 280 Tons |
| 🇸🇬 Singapore | $565 B | 4.40% | 6 M | $81,697 | 0.50% | $677 B | $735 B | $400 B | 165.1 Tons |
| 🇳🇴 Norway | $133.7 B | 2.15% | 5.5 M | $88,215 | 2.15% | $7.3 B | $15.1 B | $251.8 B | 87.9 Tons |
| 🇧🇩 Bangladesh | $475 B | 5.2 % | 173.74 M | $2,620 | 0.42% | $ 63.9 B | $ 47.1 B | $103.8 B | 14.28 Tons |
| 🇵🇭 Philippines | $462 B | 5.60% | 112.7 M | $4,200 | 0.43% | $ 127.6 B | $ 73.3 B | $275.4 B | 129.7 Tons |
| 🇻🇳 Vietnam | $476.3 B | 7.10% | 100.3 M | $4,700 | 0.45% | $380.76 B | $405.53 B | $ 165 B | 12.5 Tons |
| 🇩🇰 Denmark | $429 B | 3.50% | 5.98 M | $69,300 | 0.40% | $135 B | $ 301 B | $144.5 B | 66.55Tons |
| 🇮🇷 Iran | $437 B | 3.50% | 89.5 M | $5,779 | 0.40% | $56 B | $117 B | $4.412 B | 90 Tons |
| 🇲🇾 Malaysia | $430 B | 5.10% | 34.1 M | $12,500 | 0.40% | $330.43 B | $298.84 B | $279.1 B | 39 Tons |
| 🇪🇬 Egypt | $476 B | 4.5 % | 114 M | $4,150 | 0.44% | $90 B | $55 B | $155.09 B | 126 Tons |
| 🇭🇰 Hong Kong | $407.1 B | 2.50% | 7.524 M | $54,100 | 0.38% | $ 697.9 B | $ 639.4 B | 195.5 B | 2.08 Tons |
| 🇿🇦 South Africa | $400.26 B | 0.60% | 63.02 M | $5,709 | 0.38% | $101.2 B | $111.4 B | $290.73 B | 125.5 Tons |
| 🇳🇬 Nigeria | $252 B | 3.40% | 232.7 M | $1,200 | 0.18% | $47.2 B | 56.8 B | $43.0 B | 21.37 Tons |
| 🇨🇴 Colombia | $419 B | 2.30% | 52.9 M | $7,873 | 0.39% | $64.1 B | $49.55 B | $201.76 B | 4.68 Tons |
| 🇷🇴 Romania | $382.8 B | 0.90% | 19.02 M | $12,493 | 0.36% | $128.9 B | $93.3 B | $209 B | 103.63 Tons |
| 🇨🇿 Czech Republic (Czechia) | $345 B | 1.10% | 10.91 M | $31,707 | 0.32% | $178.70 B | $196.70 B | $143.38 B | 13.87 Tons |
| 🇵🇰 Pakistan | $374.6 B | 2.50% | 245.2 M | $1,588 | 0.34% | $53.1 B | $31.8 B | $131.1 B | 64.7 Tons |
| 🇨🇱 Chile | $330 B | 2.60% | 20.1 M | $16,400 | 0.31% | $79.7 B | $103.30 | $132.3 B | 0.25 Tons |
| 🇫🇮 Finland | $299.8 B | -0.50% | 5.64 M | $53,200 | 0.30% | $75.6 B | $80.4 B | $246 B | 49.1 Tons |
| 🇵🇹 Portugal | $308.7 B | 1.90% | 10.67 M | $22,479 | 0.29% | $112.6 B | $85.8 B | $288.8 B | 382.7 Tons |
| 🇵🇪 Peru | $289 B | 3.30% | 33.8 M | $8,320 | 0.29% | $52.1 B | $74.05 B | $94.74 B | 34.67 Tons |
| 🇰🇿 Kazakhstan | $288 B | 4.80% | 20.6 M | $14,000 | 0.29% | $59.8 B | $81.6 B | $59.9 B | 284 Tons |
| 🇳🇿 New Zealand | $258 B | -0.50% | 5.1 M | $48,000 | 0.25% | $76 B | $72 B | $120 B | 0 |
| 🇮🇶 Iraq | $279.6 B | -1.50% | 46.0 M | $4,180 | 0.26% | $104 B | $ 92.4 B. | $ 54.6 B | 162.64 Tons |
| 🇩🇿 Algeria | $269.3 B | 3.70% | 46.8 M | $5,640 | 0.25% | $53.05 B | $12.459 B | $122.06 B | 174 Tons |
| 🇬🇷 Greece | $257 B | 2.30% | 10.39 M | $21,654 | 0.24% | $89.3 B | $54 B | $413.3 B | 114.52 Tons |
| 🇶🇦 Qatar | $219.3 B | 1.60% | 2.71 M | $81,968 | 0.21% | $33.7 B | $97.9 B | $79.9 B | 109 Tons |
| 🇭🇺 Hungary | $212.5 B | 0.60% | 9.6 M | $22,147 | 0.20% | $118.4 B | $138.8 B | 163.85 B | 110 Tons |
| 🇺🇦 Ukraine | $188.9 B | 3.60% | 37.89 M | $4,990 | 0.18% | $45.5 B | $42.1 B | $160.1 B | 27.44 Tons |
| 🇰🇼 Kuwait | $153.1 B | 1.90% | 4.3 M | $35,605 | 0.15% | $43.5 B | $88.7 B | 16.3 B | 78.97 Tons |
| 🇪🇹 Ethiopia | $173.6 B | 6.70% | 132.1 M | $916 | 0.15% | $18.3 B | $3.3 B | $32.1 B | 3.07 Tons |
| 🇲🇦 Morocco | $154.43 B | 3.80% | 38.4 M | $4,300 | 0.14% | $71.4 B | $44.0 B | $100.3 B | 22.12 Tons |
| 🇸🇰 Slovakia | $141.78 B | 2.10% | 5.42 M | $26,148 | 0.13% | $115.3 B | $112.3 B | $88.7 B | 31.69 Tons |
| 🇩🇴 Dominican Republic | $124.28 B | 5.00% | 11.43 M | $10,876 | 0.12% | $32.69 B | $12.92 B | $73.26 B | 0.57 Tons |
| 🇪🇨 Ecuador | $124.7 B | 2.00% | 18.14 M | $6,800 | 0.12% | $ 29.49 B | $ 31.56 B | $ 67.02 B | 26.28 Tons |
| 🇸🇩 Sudan | $49.91 B | –20.3% | 50.45 M | $582 | 0.10% | $10.3 B | $2.8 B | $84.3 B | 533 Tons |
| 🇴🇲 Oman | $106.9 B | 1.70% | 5.28 M | $20,248 | 0.10% | $52.1 B | $38.6 B | $53.4 B | 7.5 Tons |
| 🇰🇪 Kenya | $124.5 B | 5.40% | 55.3 M | $2,293 | 0.12% | $1.2 B | $0.54 B | $1.23 B | 0.02 Tons |
| 🇬🇹 Guatemala | $113.2 B | 3.70% | 18.41 M | $6,150 | 0.11% | $32.45 B | $14.57 B | $29.8 B | 6.89 Tons |
| 🇧🇬 Bulgaria | $112.2 B | 3.40% | 6.38 M | $17,582 | 0.11% | $60.01 B | $47.85 B | $27 B | 40.87 Tons |
| 🇺🇿 Uzbekistan | $115 B | 6.50% | 36.8 M | $3,093 | 0.11% | $39 B | $27 B | $34 B | 373 Tons |
| 🇨🇷 Costa Rica | $95.2 B | 4.30% | 5.13 M | $18,587 | 0.09% | $24.4 B | $20.7 B | $57 B | N/A |
| 🇱🇺 Luxembourg | $93.1 B | 1.00% | 0.672 M | $138,608 | 0.11% | $25.5 B | $17.1 B | $24.3 B | 2.24 Tons |
| 🇦🇴 Angola | $80.4 B | 4.40% | 37.89 M | $2,365 | 0.08% | $16.1 B | $31.4 B | 64.8 B | 19.07 Tons |
| 🇭🇷 Croatia | $92.5 B | 3.80% | 3.87 M | $23,931 | 0.09% | $45.49 B | $ 26.06 B | $ 53.3 B | 0 |
| 🇱🇰 Sri Lanka | $98.96 B | 5.00% | 23.10 M | $4,516 | 0.09% | $17.82 B | $15.0 B | $96.5 B | 0.47 Tons |
| 🇵🇦 Panama | $86.3 B | 2.70% | 4.5 M | $19,126 | 0.08% | $25.1 B | $19.1 B | $49.65 B | 0 |
| 🇷🇸 Serbia | $88.9 B | 3.80% | 6.586 M | $13,514 | 0.10% | $42.25 B | $ 33.04 B | $ 39.62 B | 50.5 Tons |
| 🇱🇹 Lithuania | $84.8 B | 2.70% | 2.86 M | $28,414 | 0.10% | $44.75 B | $ 39.82 B | $ 32.9 B | 5.8 Tons |
| 🇹🇿 Tanzania | $78.78 B | 5.70% | 66.3 M | $1,185.7$ | 0.14% | $12.05 B | $7.06 B | $33.7 B | 3.7 Tons |
| 🇨🇮 Côte d’Ivoire | $86.54 B | 6.30% | 32.90 M | $2,659 | 0.10% | $17.22 B | $ 20.55 B | $51.61 B | 155.5 Tons |
| 🇺🇾 Uruguay | $80.96 B | 3.10% | 3.45 M | $23,907 | 0.08% | $10.9 B | $12.8 B | $50.8 B | 0.1 Tons |
| 🇬🇭 Ghana | $82.83 B | 5.70% | 34.43 M | $2,405 | 0.08% | $17.5 B | $15.9 B | $50.9 B | 30.5 Tons |
| 🇦🇿 Azerbaijan | $74.32 B | 4.10% | 10.34 M | $7,284 | 0.07% | $21.05 B | $ 26.55 B | $ 16.14 B | 146.6 Tons |
| 🇧🇾 Belarus | $75.96 B | 4.00% | 9.11 M | $8,317 | 0.07% | $44.2 B | $39.5 B | $29.73 B | 53.86 Tons |
| 🇸🇮 Slovenia | $72.49 B | 1.60% | 2.12 M | $34,120 | 0.07% | $45 B | $45.60 | $49 B | 3.17 Tons |
| 🇲🇲 Myanmar | $64.28 B | 1.02% | 54.5 M | $1,158 | 0.07% | $16.4 B | $14.7 B | $45.4 B | 7.27 Tons |
| 🇨🇩 DR Congo | $70.75 B | 5.70% | 109.28 M | $647 | 0.07% | $11.8 B | $29.3 B | $15.2 B | 40 Tons |
| 🇹🇲 Turkmenistan | $64.24 B | 6.30% | 7.49 M | $8,572 | 0.06% | $4.02 B | $12.37 B | $3.92 B | N/A |
| 🇯🇴 Jordan | $53.31 B | 2.70% | 11.55 M | $4,618 | 0.05% | $27.4 B | $12.8 B | $48.2 B | 71.65 Tons |
| 🇨🇲 Cameroon | $51.33 B | 3.50% | 29.12 M | $1,467 | 0.05% | $10.15 B | $7.3 B | $24.72 B | N/A |
| 🇺🇬 Uganda | $53.65 B | 6.10% | 34.43 M | $1,146 | 0.05% | $12.2 B | $8.6 B | $29.1 B | N/A |
| 🇹🇳 Tunisia | $53.41 B | 1.40% | 11.9 M | $3,987 | 0.05% | $22.5 B | $20.5 B | $44.1 B | 6.84 Tons |
| 🇧🇭 Bahrain | $47.74 B | 2.60% | 1.6 M | $30,048 | 0.04% | $20.6 B | 24.2 B | 58.9 B | 4.67 Tons |
| 🇲🇴 Macao | $50.4 B | 8.80% | 0.72 M | $73,047 | 0.05% | $15.89 B | $1.07 B | $31.712 B | N/A |
| 🇧🇴 Bolivia | $49.67 B | 1.40% | 12.3 M | $4,368 | 0.04% | $9.1 B | 9.05 B | $46 B | 22.5 Tons |
| 🇱🇾 Libya | $46.6 B | -0.60% | 7.38 M | $6,261 | 0.04% | $20.5 B | 35.2 B | $38.7 B | 146.65 Tons |
| 🇵🇾 Paraguay | $44.46 B | 4.20% | 6.93 M | $6,416 | 0.09% | $17.21 B | $10.91 B | $19.9 B | 8.19 Tons |
| 🇰🇭 Cambodia | $46.35 B | 5.50% | 17.28 M | $2,713 | 0.04% | 28.54 B | $26.7 B | $11.78 B | 54.43 Tons |
| 🇱🇻 Latvia | $45.52 B | 0.10% | 1.87 M | $22,500 | 0.02% | $23.50 B | $20.39 B | $19.5 B | 6.66 Tons |
| 🇪🇪 Estonia | $43.13 B | -0.10% | 1.37 M | $31,170 | 0.05% | $22.67 B | $19.77 B | $10.41 B | 0.25 Tons |
| 🇳🇵 Nepal | $42.91 B | 3.70% | 29.65 M | $1,447 | 0.04% | $14.12 B | $1.27 B | $10.5 B | 7.99 Tons |
| 🇿🇼 Zimbabwe | $35.92 B | 1.70% | 16.63 M | $1,913 | 0.03% | $9.53 B | $7.43 B | $23.2 B | 2.67 Tons |
| 🇭🇳 Honduras | $37.09 B | 3.60% | 10.8 M | $3,409 | 0.04% | $14.51 B | $6.97 B | $17.68 B. | 0.70 Tons |
| 🇸🇻 El Salvador | $35.365 B | 2.60% | 6.338 M | $5,580 | 0.04% | $15.97 B | $6.45 B | $88.9 B | 1.37 Tons |
| 🇨🇾 Cyprus | $36.3 B | 3.90% | 1.358 M | $38,654 | 0.03% | $13.42 B | $4.50 B | $23.65 B | 13.90 Tons |
| 🇮🇸 Iceland | $33.46 B | 0.50% | 0.384 M | $82,703 | 0.02% | $9.84 B | $6.95 B | $23.6 B | 1.98 Tons |
| 🇸🇳 Senegal | $32.27 B | 6.10% | 18.5 M | $1,744 | 0.03% | $10.60 B | $6.6 B | $42.15 B | 0 |
| 🇬🇪 Georgia | $33.8 B | 9.40% | 3.7 M | $9,090 | 0.03% | $16.87 B | $6.56 B | $12.19 B | 7 Tons |
| 🇵🇬 Papua New Guinea | $32.54 B | 3.80% | 10.58 M | $3,076 | 0.03% | $6.30 B | $ 11.62 B | $ 15.49 B | 1.96 Tons |
| 🇿🇲 Zambia | $26.33 B | 4.00% | 21.315 M | $1,535 | 0.02% | $11.27 B | $11.4 B | $23.15 B | 2.8 Tons |
| 🇧🇦 Bosnia and Herzegovina | $24.4 B | 2.60% | 3.20 M | $7,711 | 0.04% | $16.216 B | $8.89 B | $9.28 B | 1 Tons |
| 🇹🇹 Trinidad and Tobago | $26.43 B | 1.40% | 1.37 M | $19,176 | 0.03% | $7.5 B | $9.8 B | $16.46 | 2.00 Tons |
| 🇦🇲 Armenia | $25.8 B | 5.90% | 3.1 M | $8,501 | 0.02% | $17 B | $ 13.0 B | $12.84 B | 0 |
| 🇦🇱 Albania | $27.3 B | 4.00% | 2.8 M | $10,012 | 0.03% | $8.76 B | $4.35 B | $14.20 B | 3.42 Tons |
| 🇲🇹 Malta | $24.32 B | 6.00% | 0.57 M | $43,957 | 0.02% | $9.45 B | $5.40 B | $11.5 B | 0.31 Tons |
| 🇬🇳 Guinea | $36.3 B | 5.70% | 14.8 M | $2,068 | 0.02% | $6.55 B | 1.21 B | $3.92 B | 74 Tons |
| 🇲🇿 Mozambique | $22.42 B | 1.90% | 34.63 M | $647 | 0.02% | $11.3 B | $8.21 B | 21.0748 B | 1.62 Tons |
| 🇲🇱 Mali | $26.59 B | 4.70% | 24.48 M | $908 | 0.02% | $7.1 B | $525.90 B | $0.3350 B | 0 |
| 🇲🇳 Mongolia | $23.67 B | 5.50% | 3.48 M | $6,120 | 0.04% | $8.6 B | $11.8 B | $37.1 B | 16.4 Tons |
| 🇧🇫 Burkina Faso | $23.13 B | 4.90% | 23.55 M | $764 | 0.03% | $6.43 B | $5.64 B | $12.63 B | 60 Tons |
| 🇭🇹 Haiti | $25.22 B | -4.20% | 11.77 M | $2,143 | 0.01% | $6.16 B | $1.21 B | $3.92 B | 1.81 Tons |
| 🇧🇯 Benin | $21.48 B | 7.50% | 14.46 M | $1,325 | 0.03% | $3.37 B | $1.11 B | $11.48 B | 0 |
| 🇯🇲 Jamaica | $23.14 B | -0.50% | 2.82 M | $5,312 | 0.03% | $10.44 B | $2.64 B | $14.03 B | 0 |
| 🇧🇼 Botswana | $19.4 B | –3.0% | 2.52 M | $6,937 | 0.02% | $6.954 B | $ 4.2192 B | $ 6.8 B | N/A |
| 🇬🇦 Gabon | $20.87 B | 3.20% | 2.54 M | $6,619 | 0.03% | $4.00 B | $13.10 B | $7.8 B | N/A |
| 🇳🇮 Nicaragua | $19.7 B | 3.60% | 6.92 M | $2,848 | 0.02% | $11.46 B | $7.52 B | $10.1849 B | 0.07 Tons |
| 🇵🇸 State of Palestine | $13.71 B | -26.60% | 5.49 M | $2,503 | 0.01% | $8.26 B | $2.88 B | $1.32 B | N/A |
| 🇦🇫 Afghanistan | $18.08 B | 2.70% | 43.37 M | $417 | 0.05% | $10.6 B | $1.8 B | $3.43 B | 21.87 Tons |
| 🇬🇾 Guyana | $25.82 B | 43.60% | 0.831 M | $32,330 | 0.02% | $7.21 B | $22.41 B | $5.99 B | N/A |
| 🇳🇪 Niger | $13.97 Bs | 8.40% | 27.03 M | $723 | 0.02% | $3.779 Bs | $0.423 Bs | $9.1 B | 0 |
| 🇲🇩 Moldova | $18.2 B | 0.10% | 2.4 M | $7,618 | 0.02% | $9.065 B | $3.555 B | $10.2 B | 0 |
| 🇱🇦 Laos | $16.93 B | 4.10% | 7.77 M | $2,124 | 0.04% | $8.2 B | $8.1 B | $16 B | 0 |
| 🇲🇬 Madagascar | $18.52 B | 4.20% | 31.96 M | $580 | 0.02% | $5.35 B | $3.28 B | $6.4 B | 0 |
| 🇲🇰 North Macedonia | $16.69 B | 3.00% | 1.82 M | $8,876 | 0.02% | $11.97 B | $8.43 B | $10 B | 6.89 Tons |
| 🇨🇬 Congo | $15.72 B | 2.60% | 6.33 M | $2,482 | 0.01% | $25.6 B | $17.3 B | 14.99 B | 0 |
| 🇧🇳 Brunei | $15.57 B | 2.40% | 0.455 M | $34,970 | 0.02% | $1.01 B | $9.53 B | $15.71 B | 0 |
| 🇲🇺 Mauritius | $14.95 B | 5.10% | 1.27 M | $11,544 | 0.02% | $6.65 B | $1.72 B | $13.2 B | 12.42 Tons |
| 🇧🇸 Bahamas | $15.8 B | 1.90% | 4.01283 M | $39,455 | 0.01% | $4.94 B | $5.70 B | $13.15 B | 0 |
| 🇷🇼 Rwanda | $14.25 B | 8.90% | 14.26 M | $1,028 | 0.18% | $6.88 B | $3.16 B | $0.79 | 3 Tons |
| 🇰🇬 Kyrgyzstan | $17.49 B | 9.00% | 7.3 M | $2,750 | 0.01% | $11.91 B | $3.8 B | $6.62 B | 38.95 Tons |
| 🇹🇩 Chad | $15.7 B | 3.20% | 19.34 M | $563 | 0.03% | $2.2 B | $4.7 B. | $11.77 B | 0 |
| 🇲🇼 Malawi | $14.98 B | 1.80% | 21.66 M | $607 | 0.00% | $2.4 B | $0.97 B | $10.33 B | 0 |
| 🇳🇦 Namibia | $13 B | 3.50% | 3.03 M | $4,266 | 0.02% | $12.8 B | $9.5 B | $8.8 B | 0 |
| 🇬🇶 Equatorial Guinea | $12.77 B | 0.90% | 1.89 M | $6,745 | 0.02% | $2.700 B | $4.49 B | $12.77 B | 0 |
| 🇹🇯 Tajikistan | $14.21 B | 8.4%. | 10.59 M | $1,341 | 0.03% | $7.008 B | $1.947 B | $6.3 B | 8.46 Tons |
| 🇲🇷 Mauritania | $10.77 B | 5.20% | 5.17 M | $1,666 | 0.06% | $5.12 B | $3.78 B | $4.03 B | 0 |
| 🇹🇬 Togo | $9.9 B | 5.30% | 9.78 M | $1,020 | 0.02% | $2.97 B | $1.37 B | $6.8 B | 0 |
| 🇲🇪 Montenegro | $8.02 B | 3.20% | 0.64 M | $12,942 | 0.01% | $4.40 B | $0.660 B | $4.91 B | 0 |
| 🇧🇧 Barbados | $7.165 B | 4.00% | 0.3 M | $24,398 | 0.01% | $1.6004 B | $494 M | $7.438 B | 0 |
| 🇲🇻 Maldives | $6.98 B | 5.10% | 0.515 M | $17,556 | 0.01% | $3.63 B | $92.42 M | $7.83 B | 0 |
| 🇸🇱 Sierra Leone | $7.548 B | 4.4%, | 8.64 M | $779 | 0.02% | $3.8 M | $1.12 B | $2.4 B | 0 |
| 🇫🇯 Fiji | $5.841 B | 3.80% | 0.9 M | $6,288 | 0.01% | $3.10 B | $9.4 M | $10.309 B | 0 |
| 🇸🇿 Eswatini | $4.89 B | 4.90% | 1.24 M | $4,380 | 0.01% | $0.343 B | $31.105 B | $5.15 B | 0 |
| 🇱🇷 Liberia | $4.75 B | 4.80% | 5.61 M | $681 | 5.20% | $4.1 B | $1.03 B | $1.496 B | 0 |
| 🇦🇩 Andorra | $4.04 B | 3.40% | 0.1 M | $46,414 | 0.00% | $0.1574 B | $0.252 B | $1.38 B | 0 |
| 🇦🇼 Aruba | $7,41 M | 8.50% | 0.11 M | $34,985 | 0.05% | $1.53 B | $0.111 B | $5.8 B | 3.11 Tons |
| 🇸🇷 Suriname | $4.71 B | 2.80% | 0.63 M | $5,494 | 0.01% | $1.75 B | $1.48 B | $3.5 B | 1.21 Tons |
| 🇧🇿 Belize | $3.52 B | 3.50% | 0.4 M | $8,430 | 0.01% | $1.724 B | $274.8 M | $1.455 B | 0 |
| 🇧🇮 Burundi | $2.16 B | 3.90% | 14.05 M | $355 | 0.01% | $1.7 B | $153 M | $2.06 B | 0 |
| 🇨🇫 Central African Republic | $2.75 B | 1.50% | 548 M | $362 | 0.00% | $779.48 M | $425.3 M | $1.717 B | 0 |
| 🇨🇻 Cabo Verde | $2.77 B | 7.30% | 0.525 M | $5,273 | 0.00% | $915.66 M | $68.25 M | $3.09 B | 0 |
| 🇱🇨 Saint Lucia | $2.55 B | 3.90% | 0.180 M | $11,855 | $2.59 B | $800 M | $136.74 M | $1.9 B | 0 |
| 🇬🇲 Gambia | $2.51 B | 5.70% | 2.76 M | $760 | 0.00% | $988.45 M | $475 M | $1.7 B | N/A |
| 🇸🇨 Seychelles | $2.17 B | 4.00% | 0.102 M | $21,290 | 0.00% | $1.2 B | $0.54 B | $1.23 B | 0 |
| 🇱🇸 Lesotho | $2 B | 2.40% | 2.438 M | $972 | 0.00 % | $9.50 B | $0.90 B | $1.412 B | 0 |
| 🇹🇱 Timor-Leste | $2.02 B | 4.10% | 1.38 M | $1,343 | 0.00 % | $1.38 B | $0.16 B | $269 M | 0 |
| 🇬🇼 Guinea-Bissau | $2.1 B | 4.80% | 2.20 M | $786 | 0.00 % | $0.47 B | $0.24 B | $1.25 B | 0 |
| 🇦🇬 Antigua and Barbuda | $2.23 B | 6.30% | 93,772 | $18,469 | 0.00 % | $0.72 B | $33.36 M | $1.57 B | 0 |
| 🇸🇧 Solomon Islands | $1.76 B | 2.50% | 819,198 | $2,872 | 0.00 % | $0.60 B | $0.57 B | $388.74 M | 0 |
| 🇰🇲 Comoros | $1.46 B | 3.40% | 887,000 | $1,527 | 0.00 % | $0.33 B | $0.03 B | $228.8 M | 0 |
| 🇬🇩 Grenada | $1.39 B | 3.70 % | 117,207 | $10,184 | 0.00 % | $0.59 B | $0.04 B | $828.6 M | 0 |
| 🇻🇺 Vanuatu | $1.16 B | 1.00% | 330,000 | $3,543 | 0.00 % | $0.56 B | $0.35 B | $351.1 M | 0 |
| 🇻🇨 St. Vincent & Grenadines | $1.2 B | 4.90% | 100,616 | $10,520 | 0.00 % | $0.44 B | $0.04 B | $5.8 B | 0 |
| 🇰🇳 Saint Kitts & Nevis | $1.1 B | 1.50% | 46,843 | $22,771 | 0.00% | $0.42 B | $0.03 B | $5.8 B | 0 |
| 🇼🇸 Samoa | $1.07 B | 9.40 % | 218,000 | $2,000 | 0.00 % | $0.47 B | $0.04 B | $801.9 M | 0 |
| 🇸🇹 Sao Tome & Principe | $796 M | 1.10% | 235,536 | $3,245 | 0.00 % | $0.18 B | $0.02 B | $191 M | 0 |
| 🇩🇲 Dominica | $0.69 B | 3.50% | 65,765 | $18,739 | 0.00 % | $0.30 B | $0.02 B | $0.68 B | 0 |
| 🇫🇲 Micronesia | $471.43 M | 0.70% | 113,000 | $3,624 | 0.00 % | $0.20 B | $129.5 M | $48.4 M | 0 |
| 🇵🇼 Palau | $288 M | 8.30 % | 18,000 | $17,448 | 0.00 % | $54 M | $0.01 B | $0.23 B | 0 |
| 🇰🇮 Kiribati | $0.31 B | 3.90 % | 135,763 | $2,460 | 0.00 % | $0.29 B | $0.02 B | $0.035 B | 0 |
| 🇲🇭 Marshall Islands | $0.28 B | 5.00% | 37,548 | $7,467 | 0.00 % | $140 M | $93 M | $7.3 B | 0 |
| 🇹🇻 Tuvalu | $62.28 M | 3.90% | 9,646 | $6,345 | 0.06% | $70 M | $151.3 M | $11.10 | 0 |
| 🇨🇺 Cuba | $106.00 B | -1.10 % | 9.75 M | $7,433 | 0.10 % | $8.9 B | $1.30 B | $4 B | 11.24 Tons |
| 🇸🇾 Syria | $13 B | 1.50% | 24.7 M | $830 | 0.02 % | $17.56 B | $0.82 B | $23 B | 25.82 Tons |
| 🇾🇪 Yemen | $16.19 B | 1.00% | 34.83 M | $465 | 0.02 % | $4.72 B | $24 M | 13.54B | 1.56 0 |
| 🇱🇧 Lebanon | $26.0 B | -7.10% | 5.81 M | $4,473 | 0.02% | $16.9 B | $2.7 B | $34.59 B | 286.83 Tons |
| 🇸🇸 South Sudan | $5.27 B | -26.10% | 11.94 M | $441 | 0.01% | $2.7 B | $1.5 B | $2.86 B | 0 |
| 🇳🇨 New Caledonia | $9.5 B | 2.50% | 292,639 | $32,470 | 0.01% | $2.5 B | $1.2 B | $3.8 B | 0 |
| 🇮🇲 Isle of Man | $7.7 B | 3.00% | 84,523 | $91,200 | 0.01% | $1.3 B | $1.8 B | $385 M | 0 |
| 🇱🇮 Liechtenstein | $8.29 B | -1.00% | 40,000 | $207,250 | 0.01% | $1.4 B | $3.0 B | $41 M | 0 |
| 🇬🇺 Guam | $ 6.91 B | 5.10% | 167,777 | $41,400 | 0.01% | $4.0 B | $169.6 M | $2.5 B | 0 |
| 🇻🇮 U.S. Virgin Islands | $ 4.67 B | 1.30% | 85,303 | $39,300 | 0.00% | $300 M | $53.71 M | $425 M | 0 |
| 🇬🇱 Greenland | $3.34 B | 0.90% | 56,836 | $58,800 | 0.00% | $950 M | $908 M | $563 M | 0 |
| 🇦🇼 Aruba (duplicate in list) | $3.65 B | 6.80% | 108,423 | $34,029 | 6.70% | $927.524 M | $6.730 M | 5,570.5 M | 0 |
| 🇧🇹 Bhutan | $3.09 B | 4.90% | 0.8 M | $4,084 | 0.01% | $1.802 B | $0.547 M | $277 B | 3.49 Tons |
| 🇪🇷 Eritrea | $2.838 B | 2.90% | 3.54 M | $870 | 0.00% | $571 M | $482 M | $0.025 M | 0 |
| 🇸🇲 San Marino | $2.5 B | 0.70% | 33,977 | $54,265 | 0.00% | $1 B | $600 M | $2.18 B | 0 |
| 🇲🇵 Northern Mariana Islands | $1.25 B | 1.50% | 44,278 | $28,240 | 0.00% | $0.85 B | $0.35 B | $121 M | 0 |
| 🇦🇸 American Samoa | $0.89 B | 2.00% | 46,765 | $19,000 | 0.00% | $0.52 B | $0.48 B | $0.18 B | 0 |
| 🇸🇽 St. Martin | $1.735 B | 2.70% | 43,000 | $40,028 | 0.00% | $1.2 B | $0.4 B | $0.3 B | 0 |
| 🇹🇴 Tonga | $0.56 B | 3.80% | 105,000 | $5,483 | 0.00% | $0.25 B | $0.02 B | $0.44 B | 0 |
| 🇬🇮 Gibraltar | $2.91 B | 6.60% | 39,329 | $74,125 | 0.00% | $1.32 B | $1.41 B | $832 M | 0 |
| 🇰🇵 North Korea | $32 B | 3.70% | 26.0 M | $1,261 | 0.02% | $1.97 B | $388 M | $10 B | 2,000 Tons |
| Canada completely sold off its official gold reserves between 2016 and 2020. |
| T* – Trillion |
| B* – Billion |
| M* – Million |
COVID-19’s Effect on Global Markets: Lessons Learned
The COVID-19 pandemic, declared by the WHO in March 2020, unleashed unprecedented turmoil on global markets. What began as a health crisis quickly morphed into an economic catastrophe, triggering the sharpest global recession since the Great Depression. By 2025, five years on, the world reflects on a saga that wiped out trillions in market value, exposed vulnerabilities, and reshaped how economies operate. This article delves into the effects on stocks, commodities, supply chains, and more, drawing from data and expert analyses. We uncover the chaos, the recovery, and the hard-won lessons to build a more robust future.
The Immediate Onslaught: Market Crashes and Volatility (2020-2021)
COVID-19 hit like a thunderbolt. Lockdowns halted production, travel bans severed trade, and fear gripped investors. Global stock markets plummeted: The S&P 500 dropped 34% in March 2020, its fastest decline ever. Emerging markets fared worse—Asian indices fell up to 40%, reflecting ties to global supply chains.
Key impacts:
- Stock Markets: Volatility spiked. The VIX “fear index” hit 82.69 in March 2020, surpassing 2008 levels. Developed markets like the U.S. and Europe saw trillions evaporate; the Dow Jones lost 37% peak-to-trough. Emerging economies, dependent on exports, suffered amplified shocks—Brazil’s Bovespa plunged 45%.
- Commodities: Oil prices turned negative for the first time in April 2020, with WTI crude at -$37.63 per barrel due to storage shortages and demand collapse. Gold surged as a safe haven, up 25% in 2020, while agricultural commodities like corn faced volatility from disrupted harvests.
- Supply Chains: Factories in China, the “world’s workshop,” shut down, causing a domino effect. Global trade fell 5.3% in 2020, per WTO estimates. Shortages hit everything from semiconductors to pharmaceuticals.
A table of major market drops in 2020:
| Market/Index | Peak-to-Trough Decline | Recovery Time to Pre-Pandemic Levels |
| S&P 500 (US) | -34% | 5 months (August 2020) |
| FTSE 100 (UK) | -35% | 2 years (2022) |
| Nikkei 225 (Japan) | -30% | 6 months (September 2020) |
| Shanghai Composite (China) | -15% | 3 months (June 2020) |
| Sensex (India) | -38% | 8 months (November 2020) |
This phase highlighted contagion: Health fears amplified economic woes, with demand and supply shocks hitting simultaneously.
Sector-Specific Havoc: Winners and Losers
Not all sectors suffered equally. COVID-19 accelerated trends, crushing some while boosting others.
- Travel and Hospitality: Airlines lost $370 billion in 2020-2021; stocks like Delta fell 60%. Hotels saw occupancy drop to 30% globally.
- Energy and Commodities: Oil demand crashed 20%, bankrupting firms. Commodities like copper rebounded later with recovery, but initial shortages from mine closures persisted.
- Tech and E-Commerce: Big winners. Amazon’s stock doubled in 2020; Zoom’s value exploded 400% as remote work surged.
- Healthcare: Pharma stocks rose with vaccine races; Pfizer up 60% post-vaccine approval.
- Agriculture and Food: Supply chains broke, leading to food price spikes—global food insecurity rose 20% in 2020. X posts from 2024 note lingering hunger impacts in vulnerable regions.
Inequality widened: Tech giants thrived, but small businesses shuttered, exacerbating wealth gaps.
Global Responses: Policy Interventions and Market Rebounds
Governments and central banks unleashed trillions in stimulus. The U.S. Federal Reserve slashed rates to near-zero and bought $3 trillion in assets. Globally, fiscal packages totaled $12 trillion by mid-2021.
- Monetary Easing: QE programs stabilized bonds, indirectly lifting stocks.
- Fiscal Aid: Direct payments and loans prevented deeper recessions. Europe’s €750 billion recovery fund aided the hardest-hit nations.
- Market Recovery: By 2021, stocks rebounded—global equities up 50% from lows, driven by vaccines and reopenings.
Yet, inflation emerged as a side effect, hitting 8.7% globally in 2022 before easing.
The Lingering Scars: 2022-2025 Recovery and New Norms
By 2025, global GDP has surpassed pre-pandemic levels, growing 3.2% annually. But scars remain: Debt soared—global levels at 350% of GDP. Labor markets shifted; remote work persists, boosting digital economies.
- Supply Chains: Reshoring rose 20%, per EY reports. Chip shortages lingered into 2023, costing the auto industry $210 billion.
- Commodities: Energy transitions accelerated; renewables investment hit $1.7 trillion in 2023.
- Volatility Drivers: X discussions in 2025 link ongoing uncertainties to pandemic echoes, like inflation and geopolitical risks.
Recovery was uneven: Advanced economies bounced back faster than developing ones, widening gaps.
Lessons Learned: Building Resilience for the Next Crisis
COVID-19 taught brutal truths. Here’s a breakdown:
- Diversify Supply Chains: Over-reliance on China exposed risks. Lesson: Build “just-in-case” buffers, not just “just-in-time.” Firms now hold 20-30% more inventory.
- Enhance Preparedness: Stockpile essentials, invest in health tech. Telehealth adoption jumped 38x; predictive analytics now standard.
- Address Inequality: Pandemics hit the poor hardest. Policies must prioritize equity—global poverty will rise by 150 million in 2020.
- Coordinate Globally: Fragmented responses worsened chaos. The IMF pushes for transparency in procurement to curb corruption.
- Embrace Digital: Remote tools save economies. Lesson: Accelerate innovation—AI and e-commerce grew 50% faster post-2020.
- Monitor Volatility: Markets need better stress tests. X posts compare COVID crash to 2008, noting quicker recovery but persistent fears.
Developed vs Developing Economies: The Divide Narrows
The world economy in 2025 shows a narrowing gap between developed and developing economies. Developed nations, like the U.S. and Germany, rely on services and innovation, contributing 58% of global GDP ($68 trillion). Developing economies, such as India and Vietnam, drive manufacturing and growth, adding 42% ($49 trillion). By 2030, emerging markets could account for half of global output, fueled by economic reforms and policies.
Key differences and convergences:
- Economic Structure:
- Developed: Services dominate (65% of GDP). Example: U.S. tech sector.
- Developing: Manufacturing leads (30% of GDP). Example: China’s factories.
- Growth Rates:
- Developed: Slow, stable (1.7% in 2025).
- Developing: Fast, volatile (4.2%). India’s 6.8% leads majors.
- Challenges:
- Developed: Aging populations, high debt.
- Developing: Infrastructure gaps, global debt crisis risks.
| Metric | Developed Economies | Developing Economies |
| GDP Share (2025) | $68T (58%) | $49T (42%) |
| Growth Rate | 1.7% | 4.2% |
| Key Sector | Services | Manufacturing |
| Top Challenge | Aging population | Infrastructure |
The divide shrinks as digital transformation in the economy boosts developing nations’ productivity. India’s IT sector and Vietnam’s exports grow via reforms. The economic impact of climate change hits developing economies harder, but green tech adoption helps. Businesses in emerging markets can leverage how to scale an online store with low budget to compete.
Predictions for 2030 – 2050: What Lies Ahead?
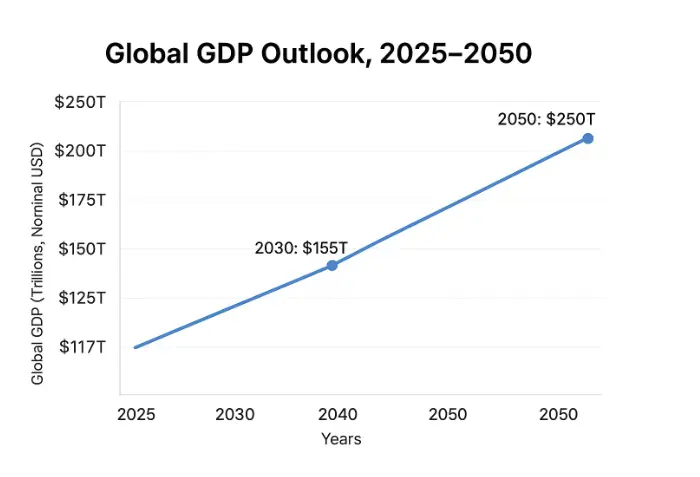
By 2030, the world economy is projected to reach $155 trillion in nominal GDP, growing at 3.2% annually, driven by Asia’s rise. India is set to overtake Germany as the world’s third largest economy, while China may surpass the U.S. by PPP, leveraging its manufacturing and tech advancements. AI-driven productivity growth could add $15.7 trillion by 2030, transforming sectors like healthcare and manufacturing. However, global supply chain challenges and geopolitical tensions in trade may slow growth, with tariffs and resource disputes cutting output by 2–3%.
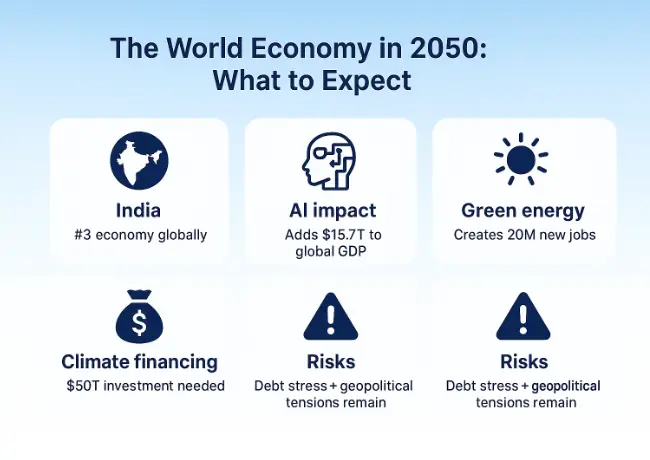
By 2050, global GDP could hit $250 trillion, doubling from 2025. Emerging markets, especially in Africa and South Asia, will contribute 50% of growth, narrowing gaps with developed economies. The economic impact of climate change poses a major risk, potentially slashing GDP by 10% if warming exceeds 2°C. Green technologies, like solar and hydrogen, will create 20 million jobs but require $50 trillion in investments. Digital transformation in the economy will deepen, with e-commerce and AI reshaping 60% of jobs.
Risks loom: US and China economic rivalry could fragment markets, while debt crises in emerging economies threaten defaults. Yet, opportunities abound—economic reforms and policies in nations like India and Vietnam will fuel growth. Businesses can prepare by adopting AI and sustainable practices, as outlined in sustainable packaging ideas for small businesses.
What future trend excites or concerns you most for the world economy?
Who Has the Best/Strongest Economy?
Who has the best economy in the world? U.S.—innovation king. Who has the strongest economy in the world? Same, resilient. Per capita: Ireland, Luxembourg.
Which economy is the best in the world? Depends: Growth=India, stability=Switzerland.
Key Institutions and Journals
IMF and World Bank roles: Lend $1T+, advise policies.
World economy journal: Deep research.
Kiel Institute for the World Economy: Trade experts.
University of National and World Economy: Trains leaders.
World Economy News Today: Fresh Updates
World economy news today: Growth beats fears. ECB cuts rates. FT Global Economy7 covers daily.
World economy 2024 recap: 3.2% growth despite wars.
FAQs
What is the world economy worth in 2025?
The world economy is valued at approximately $117.2 trillion in nominal GDP, with Purchasing Power Parity (PPP) estimates reaching $143 trillion, reflecting global output across all sectors.
Which country has the largest economy in the world in 2024?
The United States leads as the largest economy in the world 2024 GDP ranking, with a nominal GDP of $30.6 trillion, driven by technology and services.
What is the fastest growing economy in the world in 2025?
South Sudan tops as the fastest growing economy in the world by 2025 at 7.9%, but among major economies, India shines with 6.8% growth, fueled by IT and reforms.
Which countries make up the world’s top 10 economies?
The world top 10 economy list includes the U.S., China, Germany, Japan, India, UK, France, Italy, Canada, and Brazil, based on nominal GDP rankings.
What is the world’s third largest economy?
Germany holds the spot as the world’s third largest economy nominally ($5 trillion), but India ranks third by PPP due to its vast market.
Is California the 4th or 5th largest economy in the world?
California’s economy ranking in the world 2025 places it fourth or fifth, with a GDP of ~$4.2 trillion, rivaling nations like Japan.
How did World War I affect the U.S. economy?
It boosted manufacturing and exports, making the U.S. a creditor nation, though the US economy after World War I relied in large part on loans from abroad.
How did World War II affect the U.S. economy?
World War II spurred massive growth via wartime production, ending the Depression and doubling GDP, cementing the U.S. as a global leader.
What was a major effect of globalization in the late 20th to early 21st century?
Increased trade integration, boosting the world economy through interconnected markets, though it widened inequality in some regions.
What is the most common economic system in the world?
The mixed market economy dominates, blending private enterprise with government regulation, as seen in most developed vs developing economies.
What actions did Mexico take post-World War II to improve its economy?
Land reforms, infrastructure investments, and industrialization policies spurred growth, strengthening Mexico’s role in the world economy.
Conclusion
The world economy thrives in 2025. At $117 trillion, it ranks leaders like the U.S. and China while stars like India surge. AI boosts productivity, trade adapts to tariffs, and green shifts create jobs. Challenges—debt, climate, rivalry—demand smart policies. Yet, resilience shines: It shrugs off shocks.
For policymakers: Foster trade pacts. Businesses: Embrace AI. Readers: Stay informed.
What trend in the world economy excites or worries you most?
References
- The World Economy Journal
URL: https://onlinelibrary.wiley.com/journal/14679701
Publication Details: Published by Wiley; ISSN: 1467-9701 (online); Impact Factor: Not specified in content; Focuses on international economics.
Detailed Summary: This academic journal emphasizes global trade, finance, and policy issues. It covers topics like trade wars, geopolitical tensions, and economic fragmentation. Recent articles analyze impacts of tariffs, AI on productivity, and global supply chains. It contributes to discussions by providing empirical research and policy recommendations for economists and policymakers, supporting data on GDP rankings and inflation trends. ↩︎ - The World Economy Shrugs Off Both the Trade War and AI Fears
URL: https://www.economist.com/finance-and-economics/2025/10/20/the-world-economy-shrugs-off-both-the-trade-war-and-ai-fears
Publication Details: Published by The Economist on October 20, 2025; Author not specified; Reading time: 4 minutes.
Detailed Summary: The article argues that despite U.S.-China trade tensions escalating six months ago under Trump, the global economy shows resilience, with fewer disruptions than feared. Markets initially signaled recession, but consumer confidence and growth measures recovered. It addresses AI fears (e.g., job losses) as overblown, questioning what could derail growth. No specific data or quotes provided in excerpt, but links to related pieces on U.S.-China dynamics, labor markets, and microfinance. Relevant for discussions on trade wars, AI impacts, and global projections. ↩︎ - World Economy – Wikipedia
URL: https://en.wikipedia.org/wiki/World_economy
Publication Details: Community-edited; No specific date/author; Data up to 2025 estimates from IMF.
Detailed Summary: Defines world economy as aggregate human activities in production, trade, and finance. Historical shift from Asia dominance pre-1800s to West post-Industrial Revolution; inequality peaked 1970s but declined. Key stats: 2025 nominal GDP $113.8T, PPP $206.9T; Sector shares: Services 65%, industry 25%. Rankings: Top nominal (U.S. $30.5T, China $19.2T); PPP (China $40.7T, U.S. $30.5T). Covers trade ($12.4T exports 2009), debt ($56.9T 2009), energy, and COVID-19 impacts (3.4% contraction 2020). Useful for overviews of GDP, per capita, and major economies. ↩︎ - Geopolitical Tensions and International Financial Fragmentation: The 28th Geneva Report on the World Economy
URL: https://cepr.org/voxeu/columns/geopolitical-tensions-and-international-financial-fragmentation-28th-geneva-report
Publication Details: Published by CEPR/ICMB in 2025; Authors: Anusha Chari, Nathan Converse, Arnaud Mehl, Gian Maria Milesi-Ferretti, Isabel Vansteenkiste.
Detailed Summary: The report examines threats to the post-WWII monetary system from tensions like U.S.-China rivalry and Russia-Ukraine sanctions. Findings: Stable integration masks bloc-based fragmentation in FDI and assets; U.S. dollar dominance persists (58% reserves), but shifts toward renminbi in non-Western trade. Payment systems fragment with China’s CIPS. Impacts: Reduced efficiency, volatility, higher costs for emerging markets. Recommendations: Pragmatic coalitions for cooperation on trade and crises; enhance interoperability in payments. ↩︎ - The Top 25 Economies in the World
URL: https://www.investopedia.com/insights/worlds-top-economies/
Publication Details: Published by Investopedia; Data as of October 2025 IMF release; Author not specified.
Detailed Summary: Ranks top economies by nominal GDP ($117.17T global); Criteria: Nominal vs. PPP, growth, per capita. Top 10: U.S. ($30.62T nominal, 2.0% growth), China ($19.40T, PPP leader $41.02T), Germany ($5.01T), Japan ($4.28T), India ($4.13T, 6.6% growth). Details challenges like U.S. inequality, China’s aging, Germany’s demographics. Projections note post-COVID recovery; Sources: IMF, World Bank. Highlights shifts (China’s rise) and metrics like real GDP for inflation adjustment. ↩︎ - Global Economy ‘Yet to Feel the Pain’ from Tariffs, European Central Bank President Says
URL: https://www.politico.com/news/2025/10/19/global-economy-trump-tariffs-ecb-lagarde-00615067
Publication Details: Published by Politico on October 19, 2025; Author not specified.
Detailed Summary: ECB President Christine Lagarde warns that tariff pain is delayed, with businesses absorbing two-thirds of costs via margins, but inevitable price hikes will hit consumers. Tariffs and AI drive economic transformation, reshaping trade maps and alliances. U.S.-China tensions seen as posturing for negotiation. Lagarde’s insights from her IMF and ECB roles highlight policy needs. Key takeaways: Unsustainable cost absorption, potential inflation, and calls for compromise amid geopolitical risks. ↩︎ - Global Economy Section – Financial Times
URL: https://www.ft.com/global-economy
Publication Details: FT’s ongoing section; Recent articles as of October 2025; Authors vary.
Detailed Summary: Covers global growth, inflation, trade, geopolitics. Top stories: U.S.-China tariffs delaying pain (Lagarde interview, Oct 19); AI and trade reshaping economy; ECB monitoring transformations. Other pieces on emerging markets, debt, and policy reforms. Provides real-time insights into economic indicators, rivalries, and forecasts. ↩︎